The default ggcharts theme
theme_ggcharts(
  base_size = 14,
  base_family = "Cooper Hewitt",
  header_family = "Cooper Hewitt",
  axis = "",
  ticks = "",
  grid = ""
)
Arguments
| base_size |
|
|---|---|
| base_family |
|
| header_family |
|
| axis |
|
| ticks |
|
| grid |
|
Value
An object of class theme
Details
theme_ggcharts is the default theme used when creating any plot with
ggcharts.
See also
For more details see the 'theme' vignette:
vignette("theme", package = "ggcharts")
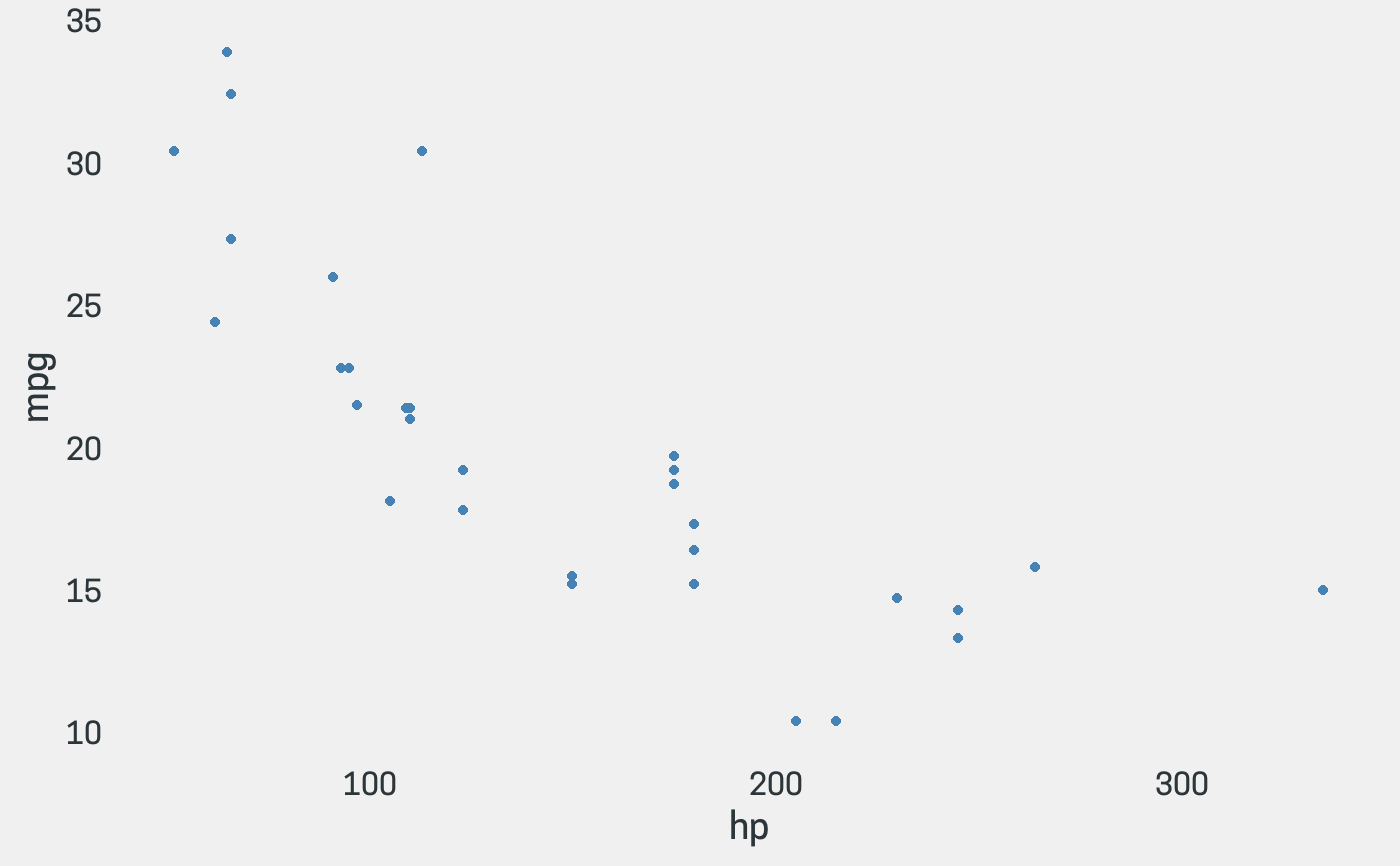
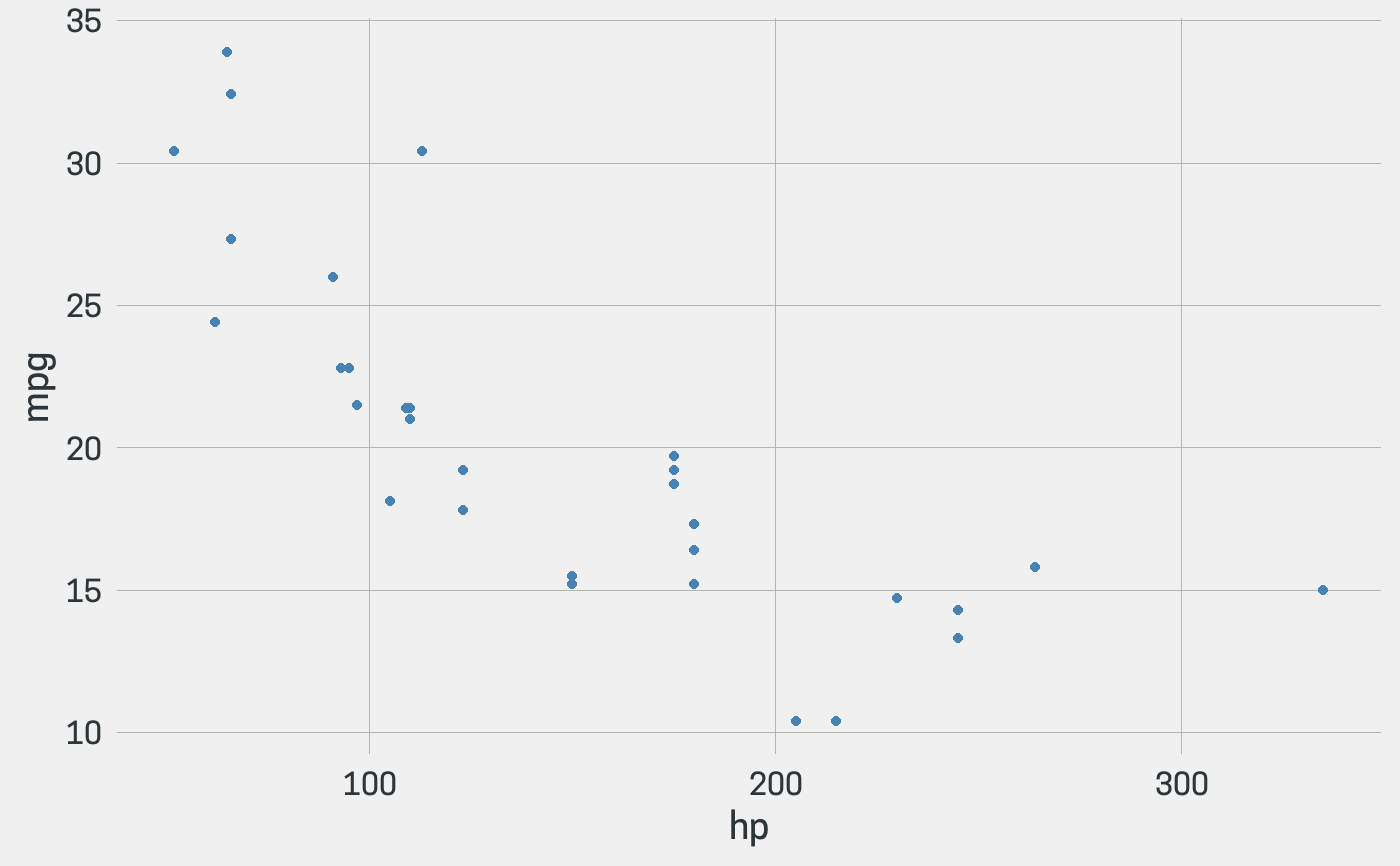
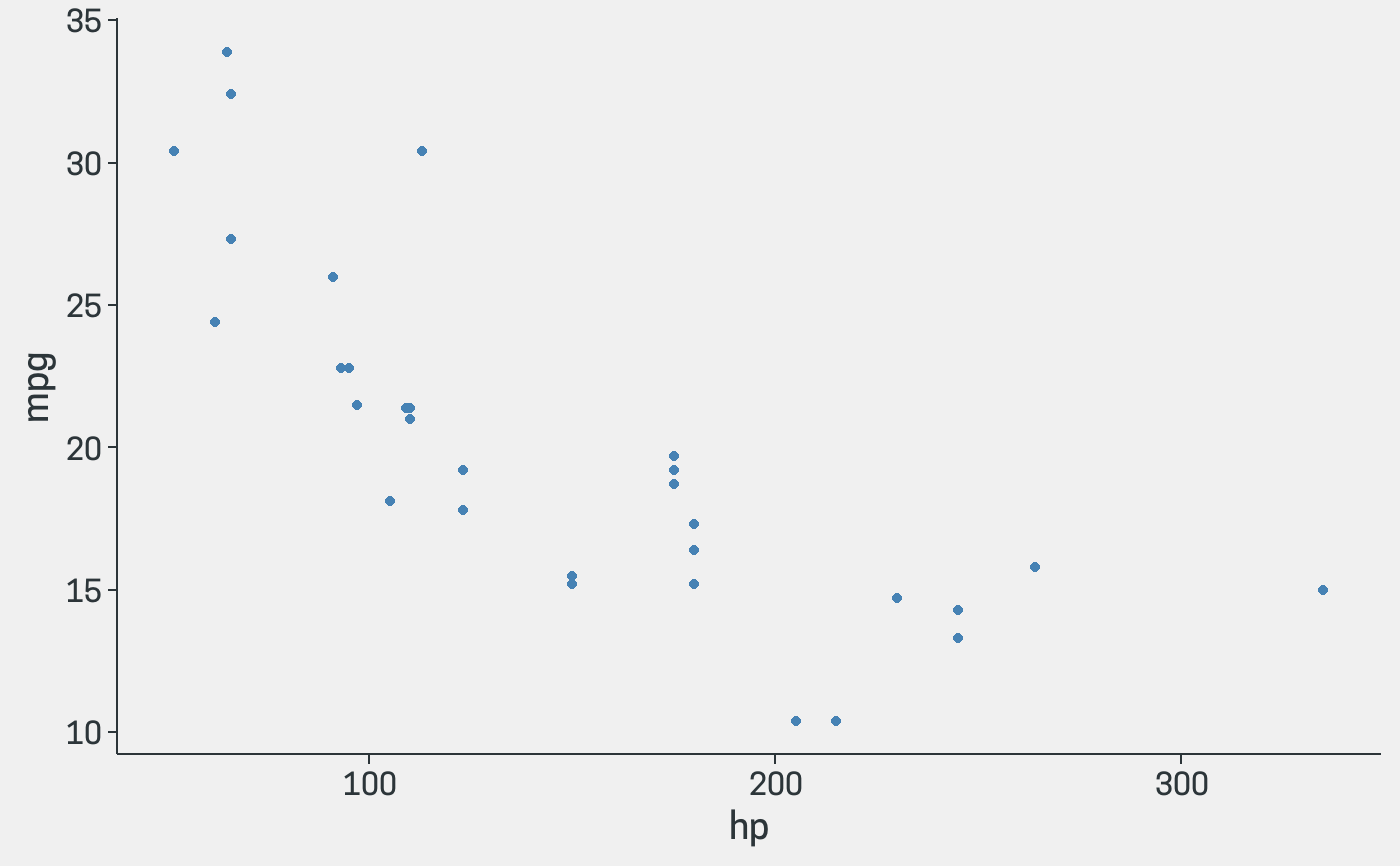
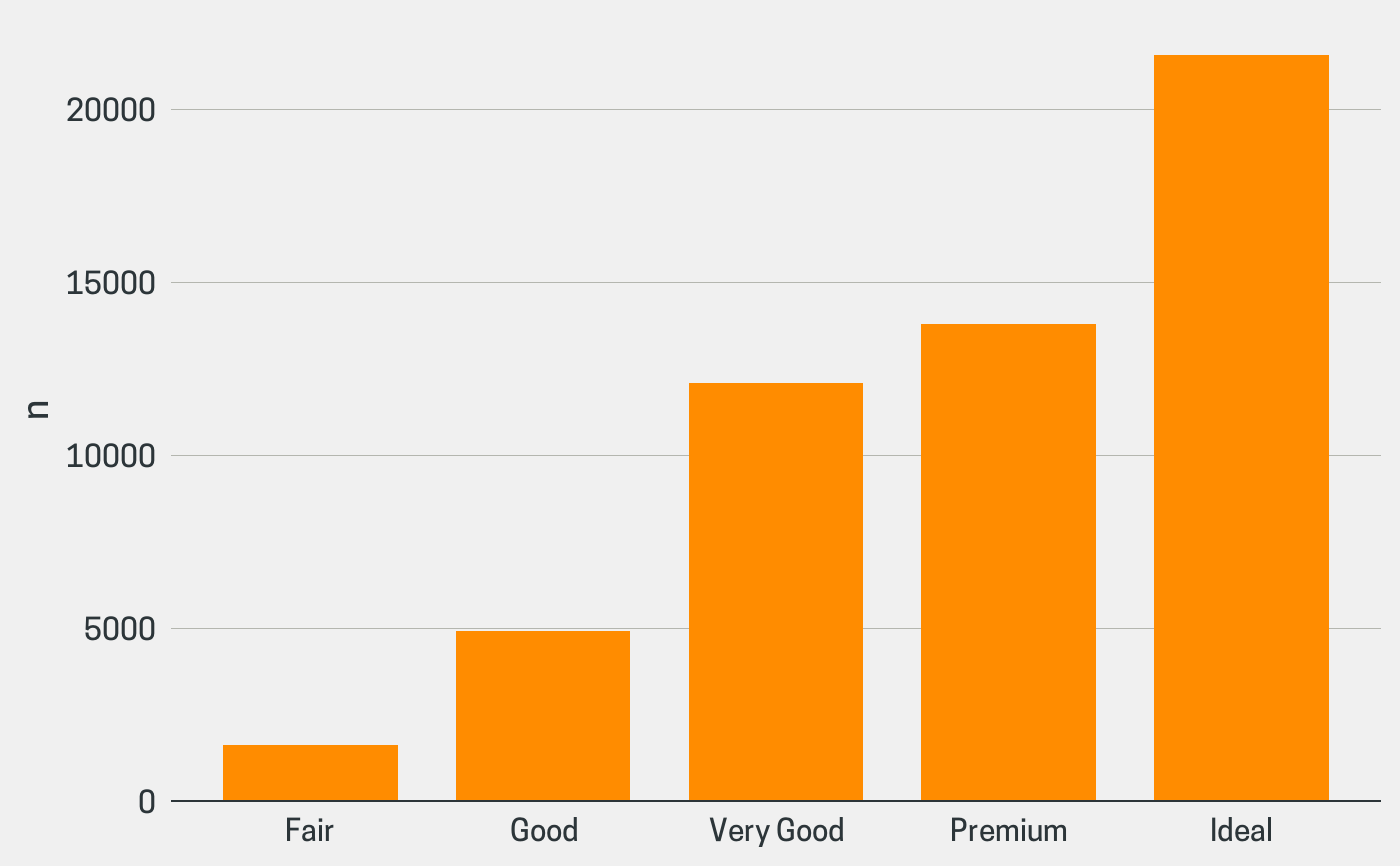
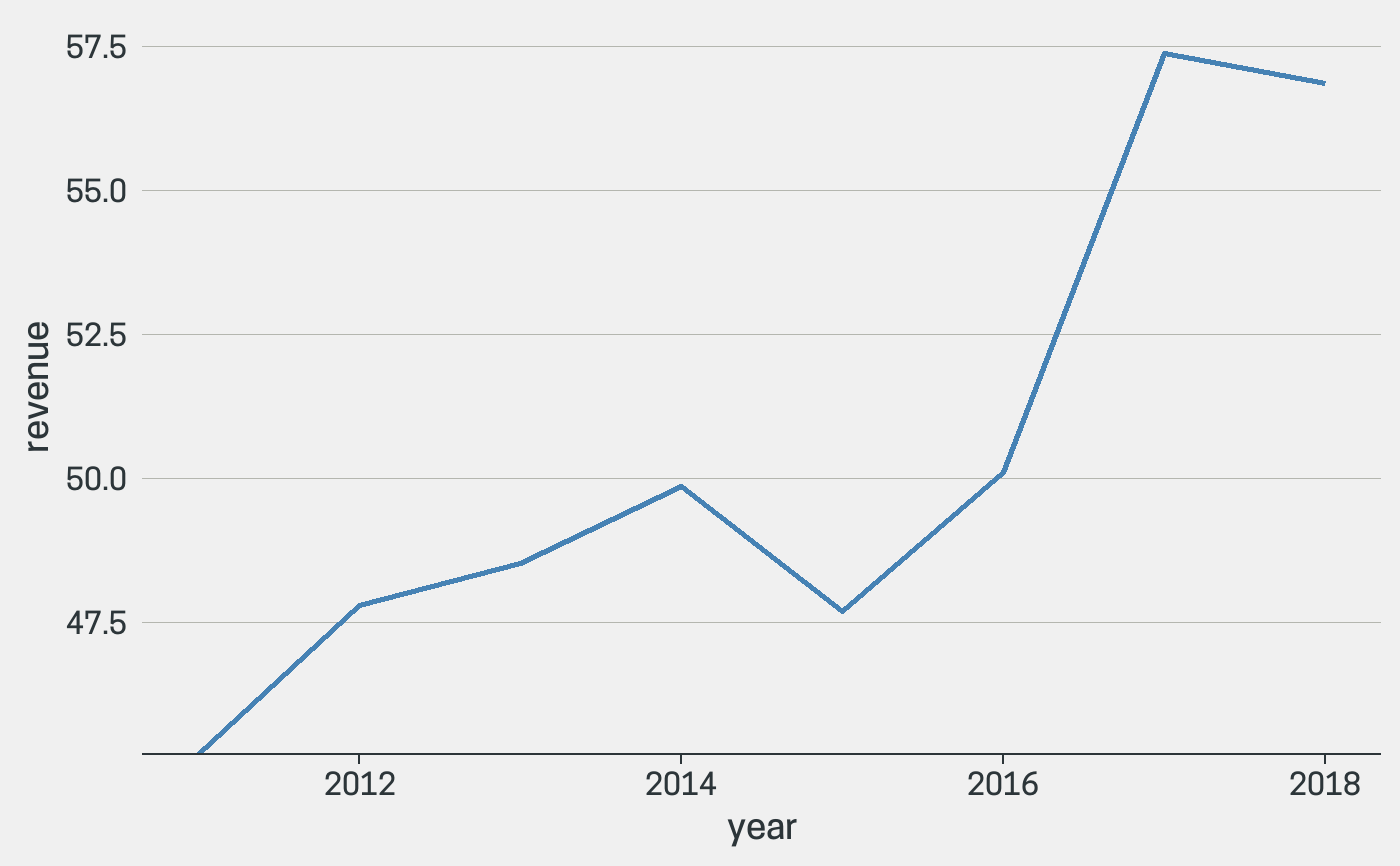
Examples
library(ggplot2) library(dplyr) scatter <- ggplot(mtcars, aes(hp, mpg)) + geom_point(color = "steelblue") scatter + theme_ggcharts()scatter + theme_ggcharts(grid = "XY")scatter + theme_ggcharts(axis = "xy", ticks = "xy")ggcharts::biomedicalrevenue %>% filter(company == "Roche") %>% ggplot(aes(year, revenue)) + geom_line(color = "steelblue", size = 1) + scale_y_continuous(expand = expand_scale(c(0, .05))) + theme_ggcharts(grid = "X", axis = "x", ticks = "x")#> Warning: `expand_scale()` is deprecated; use `expansion()` instead.