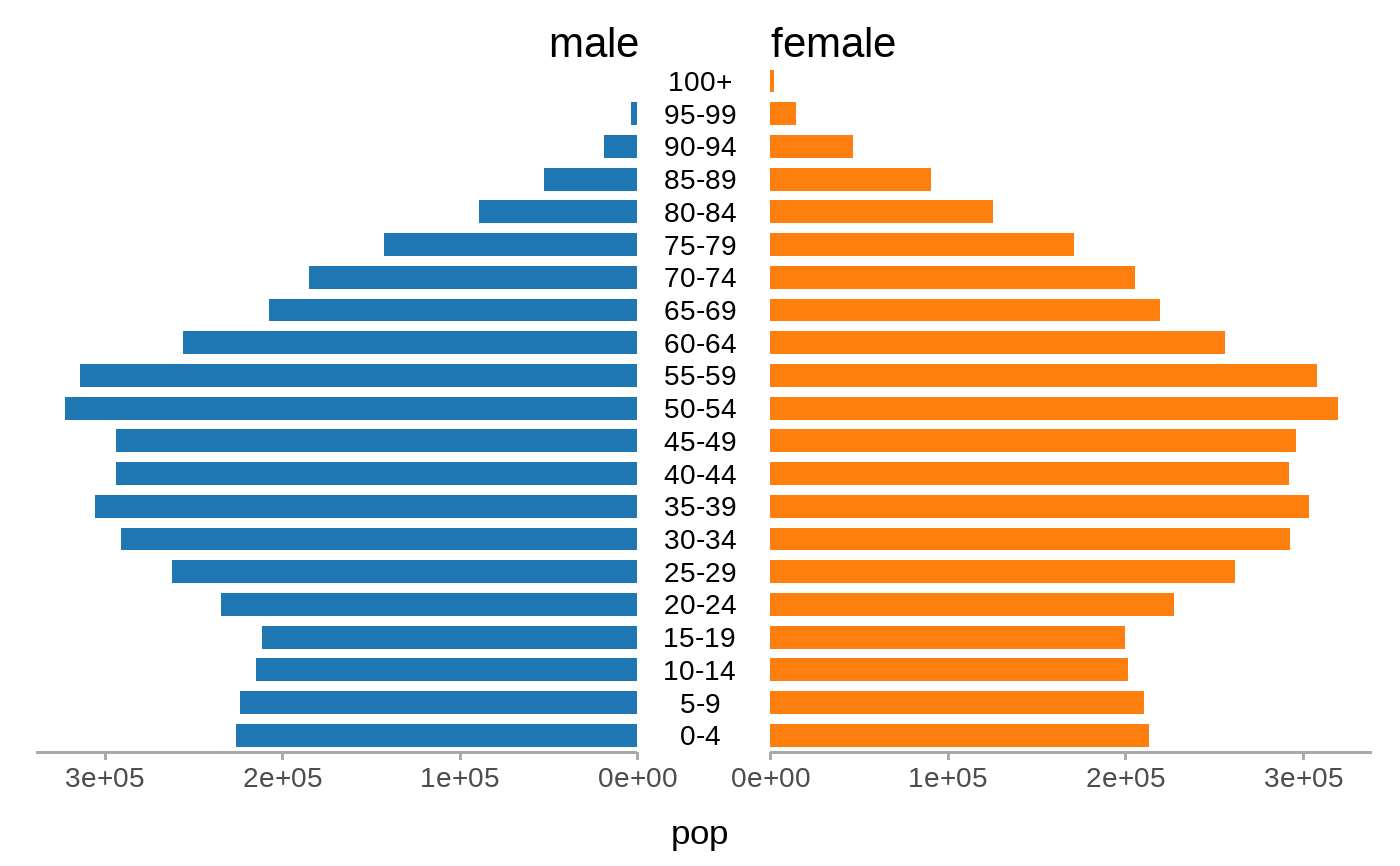
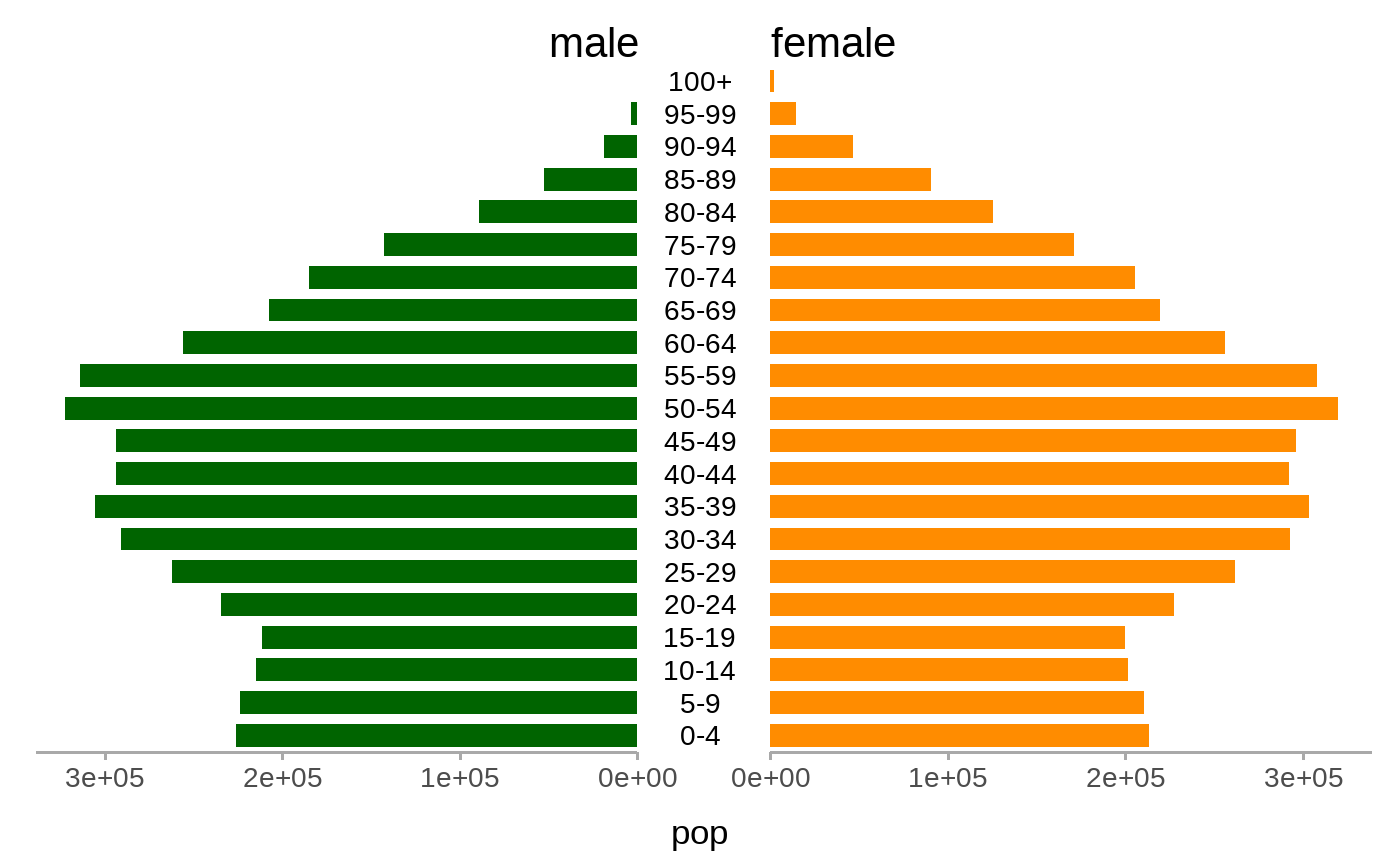
Easily create a pyramid chart
pyramid_chart(
  data,
  x,
  y,
  group,
  bar_colors = c("#1F77B4", "#FF7F0E"),
  sort = "no",
  xlab = NULL,
  title = NULL
)
Arguments
| data | Dataset to use for the pyramid chart |
|---|---|
| x |
|
| y |
|
| group |
|
| bar_colors |
|
| sort |
|
| xlab |
|
| title |
|
Value
An object of class ggplot
Examples
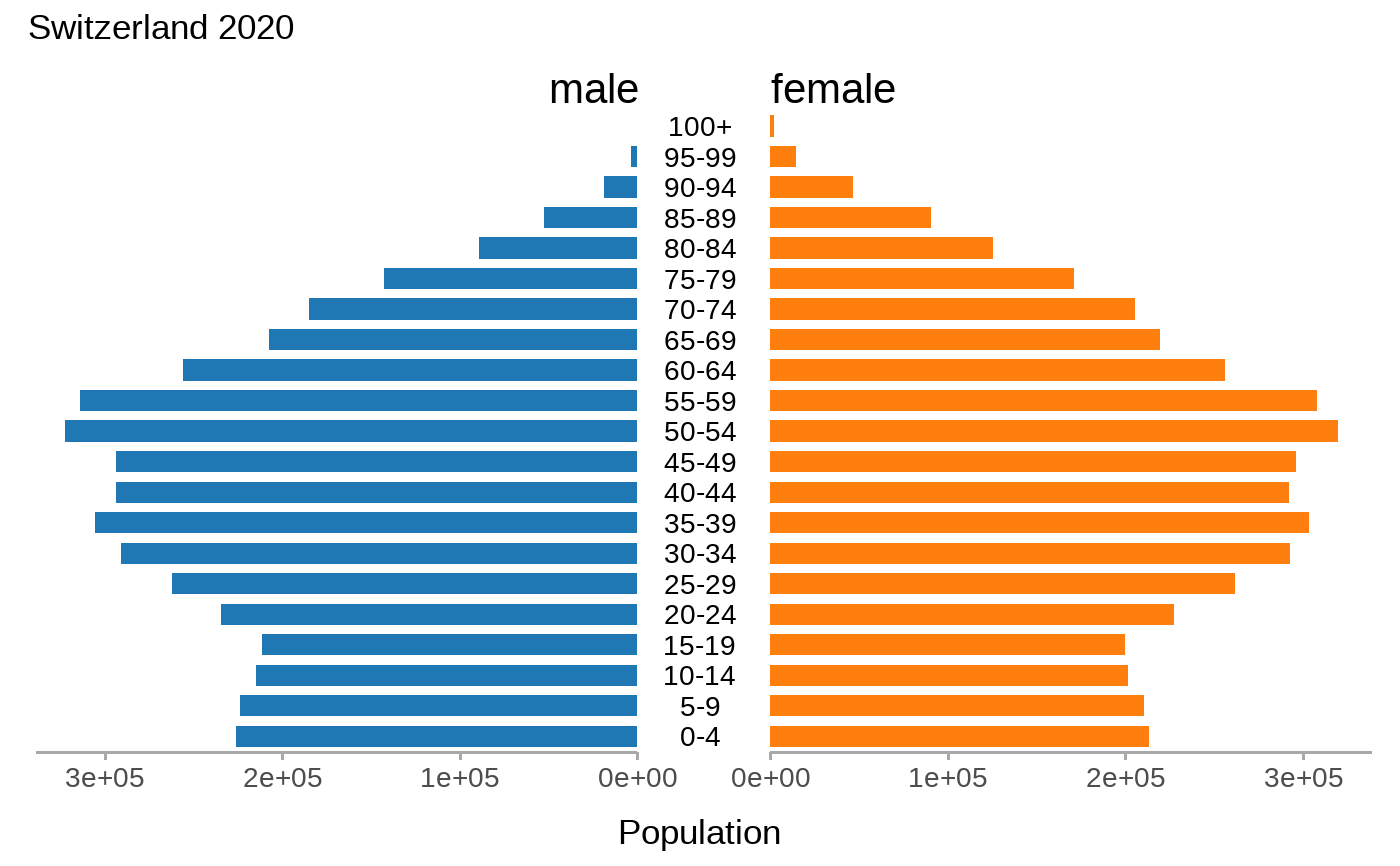
#> Warning: `expand_scale()` is deprecated; use `expansion()` instead.#> Warning: `expand_scale()` is deprecated; use `expansion()` instead.#> Warning: `expand_scale()` is deprecated; use `expansion()` instead.#> Warning: `expand_scale()` is deprecated; use `expansion()` instead.#> Warning: `expand_scale()` is deprecated; use `expansion()` instead.#> Warning: `expand_scale()` is deprecated; use `expansion()` instead.#> Warning: `expand_scale()` is deprecated; use `expansion()` instead.#> Warning: `expand_scale()` is deprecated; use `expansion()` instead.## Change x axis label and add title pyramid_chart(popch, age, pop, sex, xlab = "Population", title = "Switzerland 2020")#> Warning: `expand_scale()` is deprecated; use `expansion()` instead.#> Warning: `expand_scale()` is deprecated; use `expansion()` instead.#> Warning: `expand_scale()` is deprecated; use `expansion()` instead.#> Warning: `expand_scale()` is deprecated; use `expansion()` instead.