Easily create a dumbbell chart
dumbbell_chart(
  data,
  x,
  y1,
  y2,
  line_size = 1.5,
  line_color = "lightgray",
  point_size = 4,
  point_colors = c("#1F77B4", "#FF7F0E"),
  sort = TRUE,
  horizontal = TRUE,
  top_n = NULL,
  legend = TRUE,
  legend_labels = waiver(),
  limit = NULL
)
Arguments
| data | Dataset to use for the dumbbell chart |
|---|---|
| x |
|
| y1 |
|
| y2 |
|
| line_size |
|
| line_color |
|
| point_size |
|
| point_colors |
|
| sort |
|
| horizontal |
|
| top_n |
|
| legend |
|
| legend_labels |
|
| limit | Deprecated. use |
Value
An object of class ggplot
See also
To learn how to further customize this plot have a look at the 'customize' vignette:
vignette("customize", package = "ggcharts")
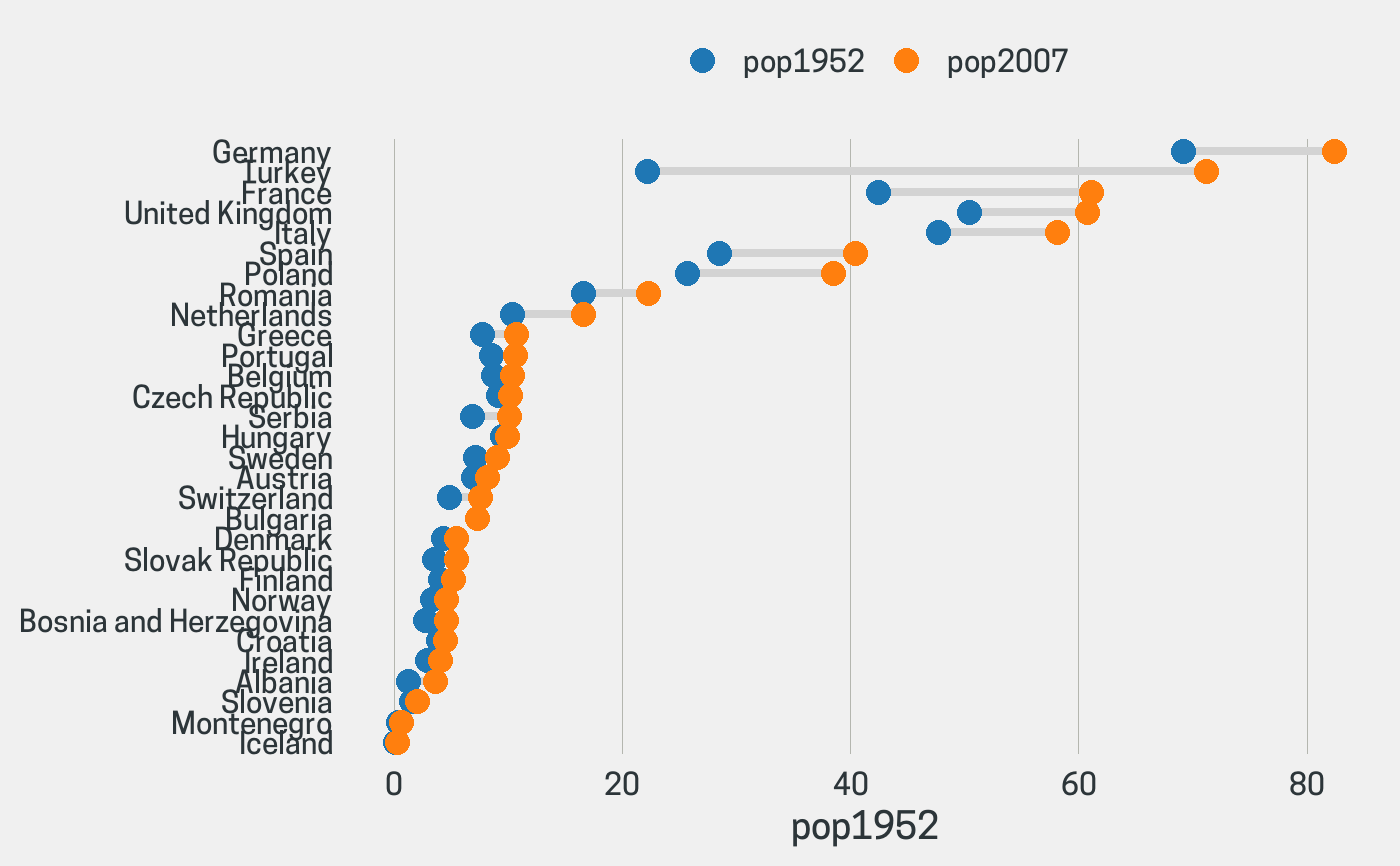
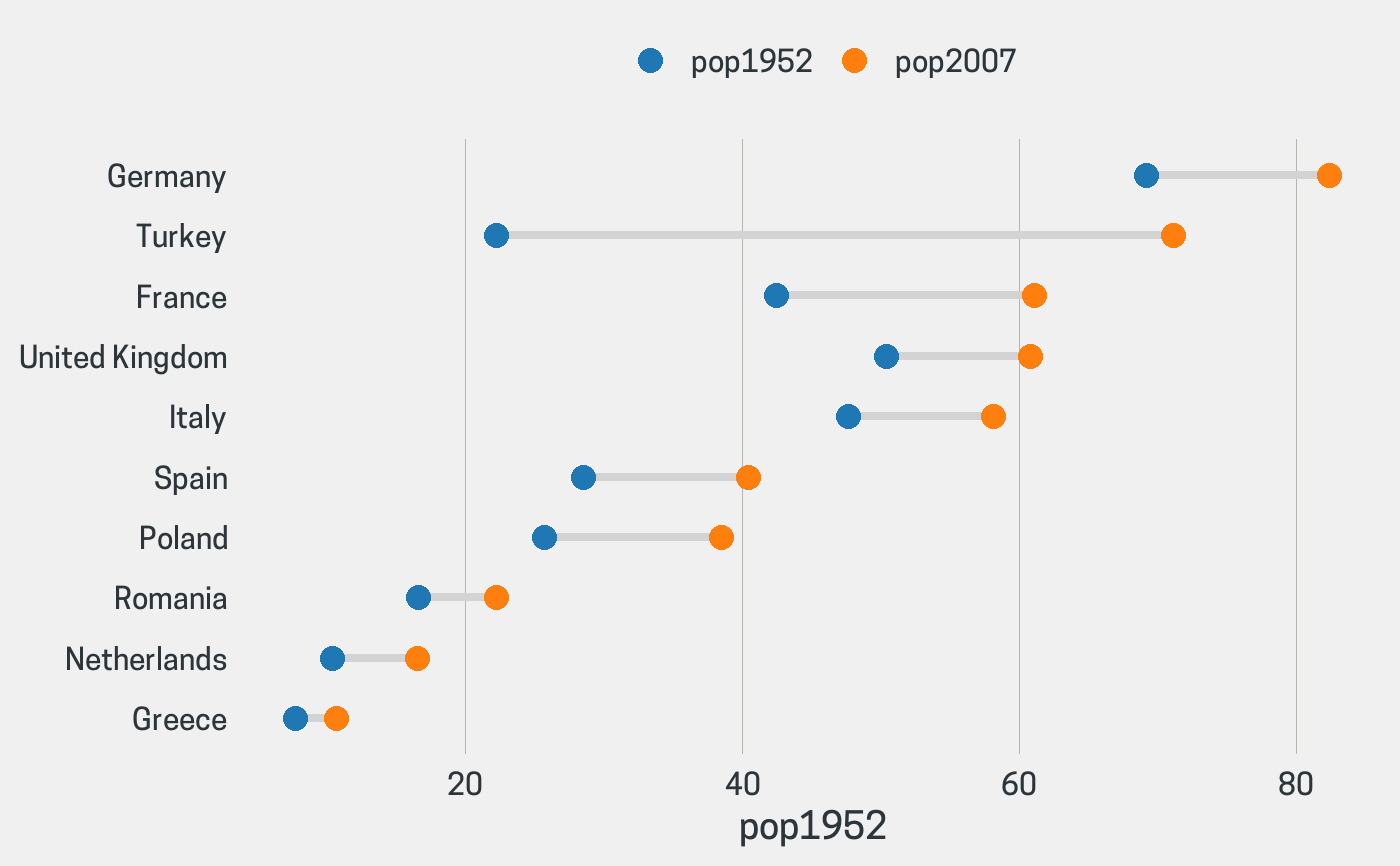
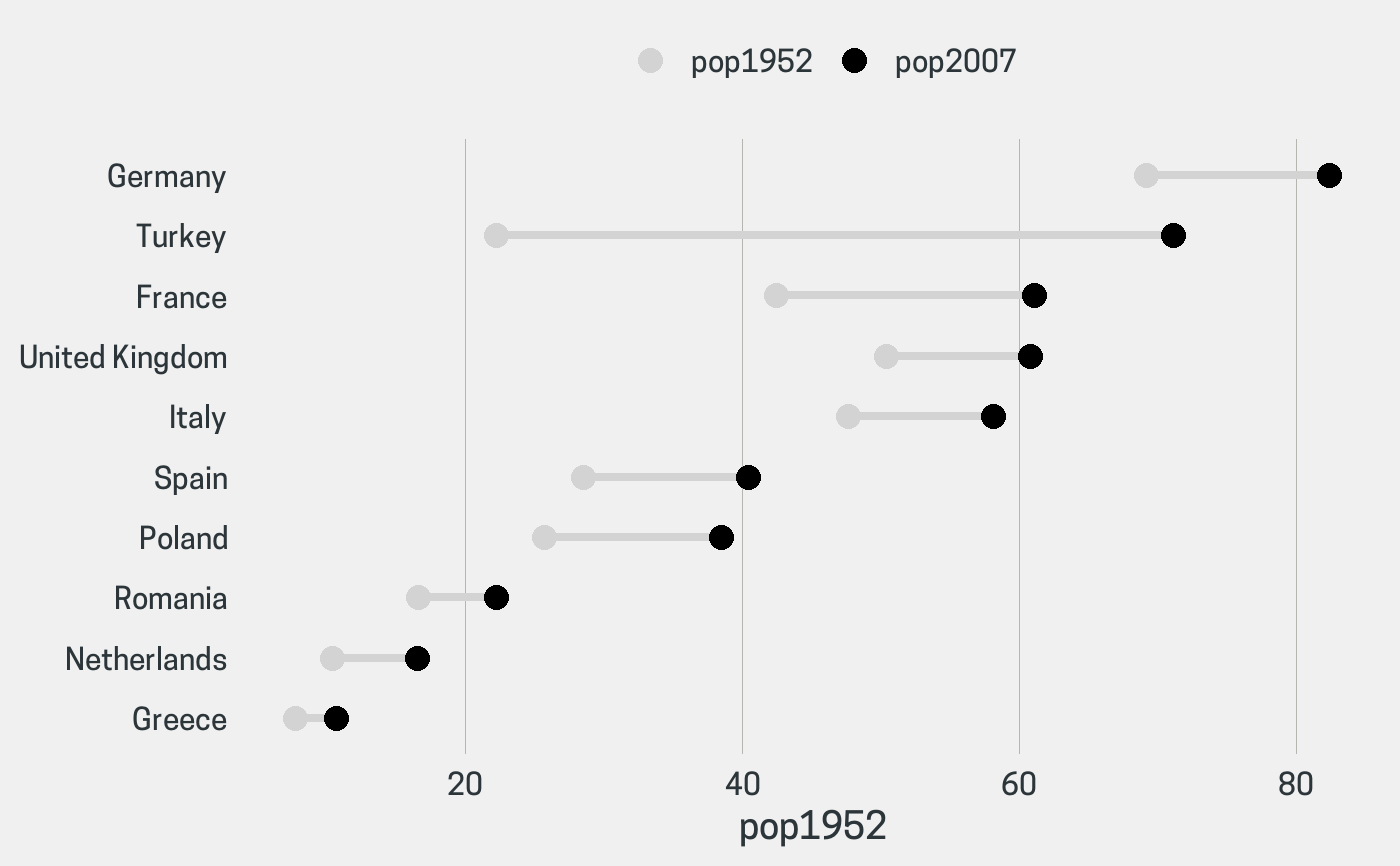
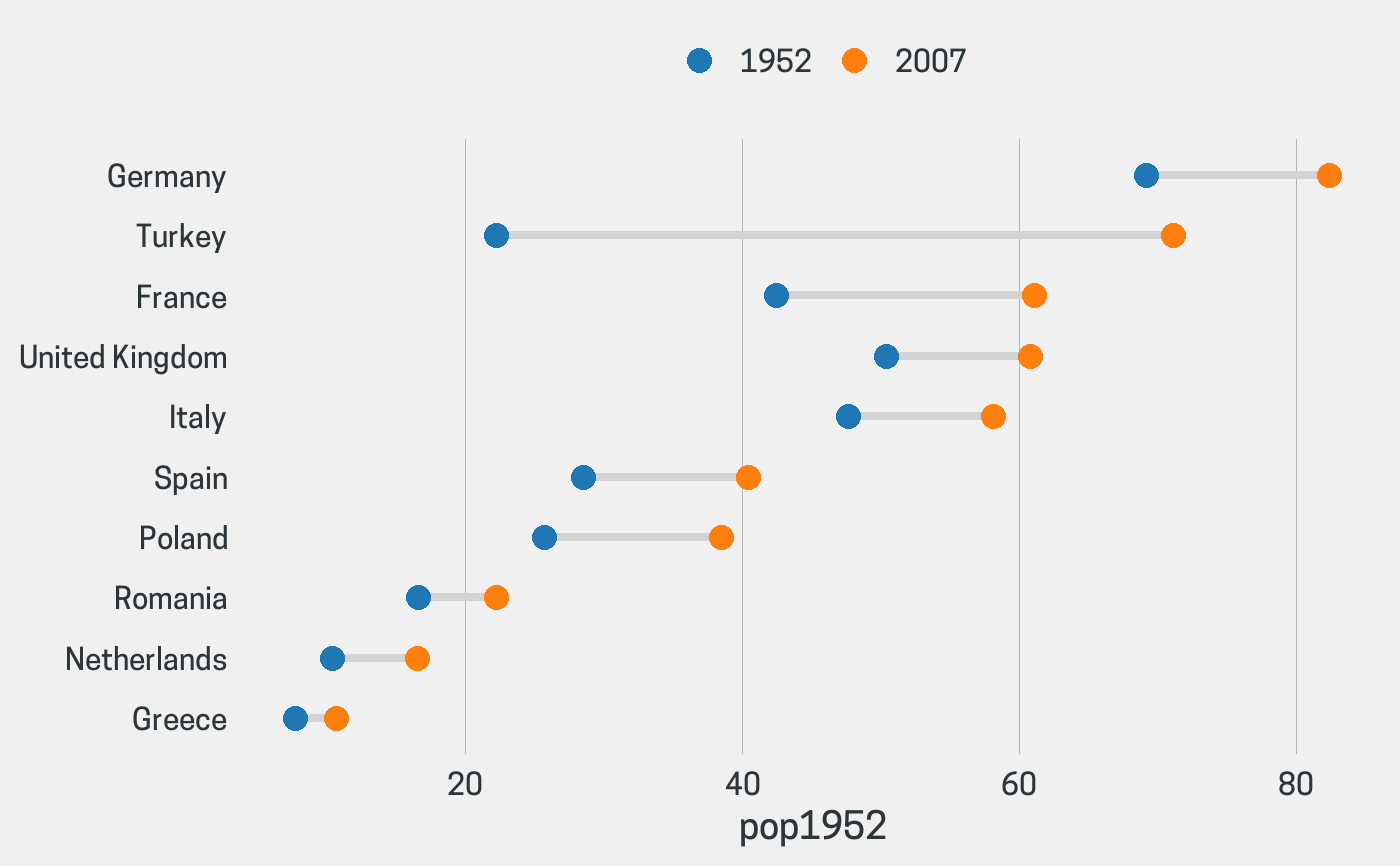
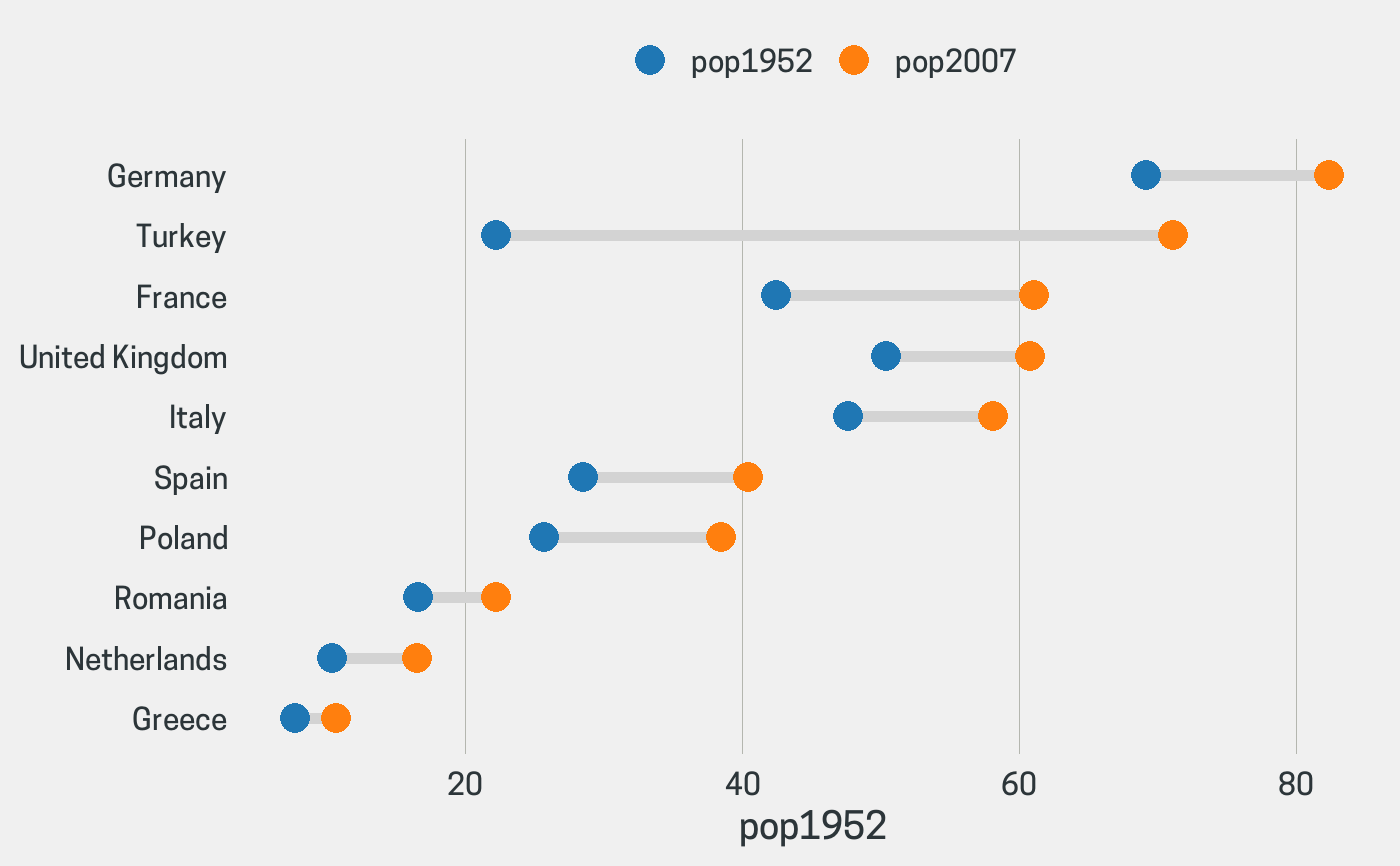
Examples
# Display only the top 10 countries in terms of population in 2007 dumbbell_chart(popeurope, country, pop1952, pop2007, top_n = 10)# Change line and point color dumbbell_chart(popeurope, country, pop1952, pop2007, top_n = 10, line_color = "lightgray", point_color = c("lightgray", "black"))# Add custom legend labels dumbbell_chart(popeurope, country, pop1952, pop2007, top_n = 10, legend_labels = c("1952", "2007"))# Increase line width and point size dumbbell_chart(popeurope, country, pop1952, pop2007, top_n = 10, line_size = 2, point_size = 5)